“Ten years, ten years man!” Jeremy Piven, Grosse Pointe Blank
2010 doesn’t seem all that long ago at the moment. While that is possibly a function of advancing age, and decreasing memory on my part, ten years does provide a nice reference point for a look back at training theory and practice over the preceding decade.
Luckily for me, as I have no .edu mailbox and thus no ready access to clinical studies save abstracts, my good friends at PezCyclingNews have a weekly training column known as the Toolbox to help get us started.
Let’s start with advances in technology and its application. In 2010 I wrote a detailed review of The Sufferfest videos – at the time they were right on the edge of indoor training via a series of videos that, essentially, gave you visual encouragement to suffer a lot while watching pro riders race all over the World. I was curious about the actual power metrics on offer in the series and set about building .erg files for three of their videos. Yep, I actually downloaded a Sufferfest users excel spreadsheet and manually entered the on screen cues to create the actual intended workout! It was time consuming but kinda fun to do.
Ah, Built By Hand!
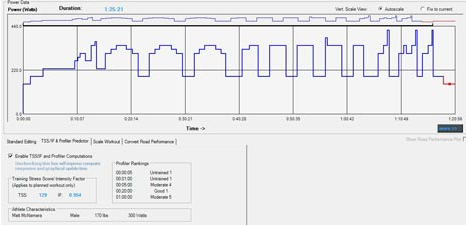
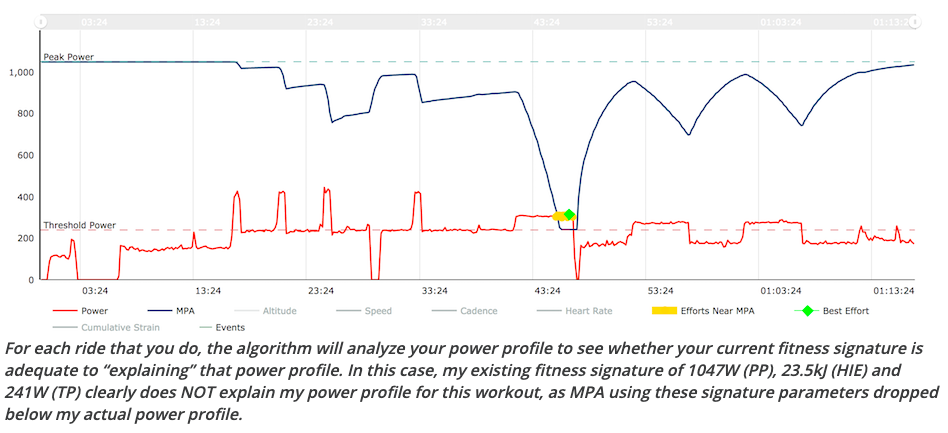
Contrast that with Toolbox Editor Stephen Cheung’s 2018 introduction of Xert, a math based power algorithim and training analysis tool that raises the bar on power based analytics along with the groundbreaking work of the folks at Training Peaks who brought WKO3, 4, and 5 to market over the last 10 years. What I find particularly cool about the advancements is just what you would too…the ability to accurately infer physiological systems and performance from power files. We’ve long had pretty good estimates of VO2max derived from a calculation, but now it goes much deeper looking also at the mix of energy systems in use and predicting things like MPA, maximum power available, a sliding metric of anaerobic energy that can track you efforts in real time! Paired with good estimations of energy cross over points for fat and carbohydrate, time to exhaustion at threshold power, and the entire power duration curve in highly accurate ways allow even recreational riders access to World class data to use for themselves.
MPA in Real Time! Modern Metrics Are Cool
Taking this evolution in technology to the biomechanics of cycling is also an interesting path to walk over the last ten years.
one of my favorite graphs of all time! Muscle activation during the pedal stroke!
In March of 2010 I wrote a review of Pedaling Dynamics. It was a fun one to write as I got to dig into the biomechanics and muscle activation patterns of pedaling, two of my favorite topics. At the time, and still prevalent today, was the idea that fast pedaling was the “right” way to do it, but the central takeaways from the research reviewed was that riders tend to have a natural rhythm at sub-threshold intensities. This is important because when we look at effectiveness (force generation into speed) versus efficiency (minimizing muscle activation and subsequent energy depletion) it comes down to an individual riders preferences as much as anything, so don’t default to fast pedaling in all situations as it may not be your most effective cadence choice in a given situation. This is a very common learning curve for new riders – they pedal really really fast but spend a ton of energy doing so because they aren’t yet efficient at pedaling! The graphics were somewhat dated, but the fundamentals were solid.
Since then things have taken a definite turn to the technological with the rise of analysis tools like the Leomo system and the advanced analysis from dual sided crank and pedal based power meters. I’ve played with a Leomo a bit in 2017, though I didn’t end up writing about it, and I think it’s pretty viable. Ditto for the pedaling analysis in other tools. We can now do a good job of actually quantifying an athletes mediocre pedaling dynamics, and more importantly helping to change ’em! I’m hoping to dig into those a bit more in 2020, should be fun.
I could go farther, but I think that covers the idea I meant to convey. Since 2010 we’ve seen amazing advances in the way information is presented and in the quality of the information on offer, but there hasn’t been a sea change in the fundamentals of cycling – it’s an aerobic sport, VO2max matters when push comes to shove, pedaling is important and knowing what and how to differentiate these elements is vastly easier and more effective than it was a decade ago.
Facebook and Zwift have been amok this year with the question “Does FTP mater anymore?” and opinion ensues about yes or no. Arguments against include “most races come down to a sprint” or some variation on steady state being irrelevant to competition. While true in a vacuum, it’s important to remember a few things about the relative importance of training your Functional Threshold Power…
I’m not interested in making this a primer on Threshold, so let’s cover a few essentials to get this over with..
FTP is derived from an interpretation of actual research spread across numerous high quality studies. That research established that there is a cross over point at which, among other things, the body shifts from a primarily aerobic energy source, to primarily anaerobic energy sources. It IS an essential part of athlete development in endurance sports. It is not the only measure that matters. It is also NOT a “best 60 minute” effort (although I think those are great too!). FTP is your best sustainable power for “a very long time” – that can be 30 minutes or over an hour.
OBLA, MLSS, FTP, LT1/ LT2 – lots of terms bounce around, but they all aim to establish a cross over point at which the athlete moves from sustainable to unsustainable effort level. Lest we forget cycling, even races that end in a sprint, is an aerobic sport requiring lots of muscle endurance. If you can’t ride at a fairly high steady state, you’ll probably get dropped.
FTP is more of a reference point on the continuum of efforts. It is not the holy grail of performance, nor is it to be easily dismissed as irrelevant. It is a great jumping off point for creating meaningful training intensities, baseline estimation of VO2max (FTP is very commonly ~85% of VO2max), and gauging when you are going too hard. Early stage athletes (less than three years training) should focus on their FTP as a condition of improving as a rider. More experienced riders can use FTP as a marker of current fitness.
Probably Over Threshold!
Gawd, forgive me..I started reading some threads to catch up on the arguments and it just got SOOO boring! All these opinions and interpretations of what is really pretty straight forward science. In general most threads lack any reference to the science, let alone citations of research. Since I’m not interested in re-hashing previous research and writing I’ve done I”m just gonna post it…
Lactate and Lactic Acid production are routinely offered as the seemingly natural cause and effect parameters that cause fatigue and decrease in performance, but are they really the source of the problem?
By Matt McNamara
If you’ve read anything about training in the last ten years you’ve probably come across the idea of Lactate Threshold and a discussion of how lactic acid production limits performance. The argument often goes something like this:
“As exercise intensity increases lactic acid production rises at a rate that, eventually, overwhelms the bodies ability to buffer this build-up and a decrease in performance naturally follows.”
Heck, I’ve repeated the mantra myself time and again over the years, despite KNOWING that it was an incomplete explanation of what actually happens. The truth is it provides a simple, though not wholly inaccurate, way to explain the well-documented trends of decreasing performance with increasing lactate concentrations. The idea of cause and effect just sort of fit well. So rather than perpetuate mediocre understanding, let’s jump in and learn a bit more:
A Brief, Albeit Incomplete, History Lactic Acid was first isolated by Swedish researcher Carl Wilhelm Scheel from a batch of sour milk in 1780 (hence the commonly used term “lactic” instead of the far sexier formal name of 2-hydroxypropanoic acid, but I digress). Otto Meyerhoff and Archibald Hill, Nobel Prize winners in 1922, demonstrated that Lactic Acid was actually produced as a side reaction of Glycolysis, a primary metabolic pathway that converts carbohydrate/glucose into pyruvate, in the process converting energy into ATP through a 10-step set of reactions. In the absence of oxygen this conversion is sustained with Lactic Acid. This anaerobic process releases a proton (H+).
This was a key finding as it seemed to offer a cause and effect relationship between lactate production (lactate is, essentially, the salt or base of Lactic Acid) and the extended concept of Lactic Acidosis, or a decrease in pH that results from the release of protons in the system (cell or bloodstream).
This cause and effect relationship was taken as fact by researchers throughout the 20th and into the 21st century. However, in reviewing past and current research, Robergs et al (2004) have shown that there was no actual empirical evidence to support the cause/effect relationship; rather it was largely based on statistical correlation and the reputation of the Nobel Laureates Meyerhoff and Hill (which was richly deserved, I might add).
So, if the cause and effect nature of lactate production and acidosis is not an accurate portrayal of the role of Lactate in the onset of acidosis, and therefore performance, what is?
Debunking Lactic Acidosis In 2004 Roberg, et al wrote an extensive review of the literature that sought to debunk the long-standing cause and effect relationship between lactate production and metabolic acidosis. Their sixteen page review takes an exhaustive, and somewhat intimidating, look at the true biochemistry of metabolic acidosis.
For example they detail the role of the phosphagen, glycolytic and mitochondrial systems in producing ATP and the differences in how each manages any released protons. They also note the difference in the nature of the proton release in glycolysis depending on whether the carbohydrate was derived from blood glucose or muscle glycogen. Glycogen is less acidifying to muscle during intense exercise.
Roberg then goes on to detail the many benefits derived from lactate production including the alkalizing effect of LDH, Lactate Dehydrogenase, or that it then circulates away the lactate to other areas that need it including the kidney, liver, and heart, for use as a substrate.
Finally, they looked at the role of nonmitochondrial ATP production, via research by Gevers in 1977 and 1979. Gevers established that metabolic processes other than LDH might contribute to the removal of protons in the form of the turnover of ATP via glycolysis. In other words that non-mitochondrial ATP production was likely responsible for metabolic acidosis.
But here’s where lactate threshold based training comes in
Training Threshold Lactate threshold based training is a great tool. More specifically using the combination of a powermeter and a threshold based training approach is a highly effective way to manage your training.
Andy Coggan recently hosted a webinar on Lactate Threshold via USA Cycling. In addition to a comprehensive look at the establishment, definitions, and relationships of training around one’s lactate threshold. Among the cool takeaways
The first is to see terminology like Lactate Threshold, Maximal Lactate Steady State, Onset Blood Lactate Accumulation, etc as talking about roughly the same range of intensity. It’s likely going to be between about 80-90% of your VO2max for sustained periods of time. This will raise your general metabolic fitness. Further specialization is ideal for targeting specific race preparation
Coggan also noted that it has been shown in a wide array of studies that many other factors and processes contribute to fatigue. Things like epinephrine/norepineprine (adrenaline/noradrenalin), plasma potassium, and cortisol level, etc. often show a similar threshold type profile to that of lactate.
Abiss and Laursen did a comprehensive look at fatigue in 2005. Models to Explain Fatigue During Prolonged Endurance Cycling looked at no fewer than 10 different models of fatigue including the cardiovascular/anaerobic model, neuromuscular biomechanical, thermoregulatory models, and several others. Their net conclusion is that any number of systems may contribute to fatigue in a specific way for a specific situation, but in general the limitation of the system is derived from oxygen delivery to the muscles. Since we established above that metabolic acidosis is not derived from lactic acid, but that lactate production is an important contributor to oxygen delivery, it time to embrace those burning quads and get to work improving that lactate tolerance.
Perhaps next time we’ll look at that – drop me a line if you’re interested in a part 2.
References:
1. Abbiss, Chris, Laursen, Paul – Models to Explain Fatigue During Prolonged Endurance Cycling. School of Exercise, Biomedical and Health Sciences, Edith Cowan University, Australia. 2005 2. Coggan, Andy – Explaining Lactate Threshold. Webinar Presentation. 2010 3. Robergs, Robert A., Ghiasvand, Farzenah, Parker, Daryl – Biochemistry of exercise-induced metabolic acidosis. Am J Physiol Regul Integr Comp Physiol 287: R502–R516, 2004
It is a common misnomer that Lactic Acid is the cause of fatigue and cessation of high intensity exercise, yet training plans built around your individual Lactate Threshold are highly effective despite the debunking of the “Lactic Acidosis” rationale. Let’s learn why…
By Matt McNamara
Last month we looked at the intricacies of Lactic Acid/Lactate production and its role in limiting performance. The short summary of that article is to say that Lactic Acid production is NOT the limiter in high intensity exercise, and the science behind that belief was founded on an inferred cause and effect relationship between lactate production and cessation of exercise that, ultimately, proved to be untrue.
While lactate production may not be a limiter, it is clearly a marker of overload and does play a role in athletic development and performance. Lactate Threshold based training, when paired with use of a powermeter, is seen as the gold standard for endurance based performance improvement. So let’s explore the real meaning and value of Lactate Threshold based training.
What Does Lactate Threshold Really Mean? First off, Lactate Threshold is commonly defined as “the exercise intensity at which lactate production exceeds lactate removal, and thus begins to accumulate in muscle and hence in the blood.” Unfortunately, the definition of what constitutes “Lactate Threshold” is highly variable.
Many researchers establish threshold as the point when lactate concentration rises 1 mmol above an exercise baseline. Others use a fixed value, for example 2.5 mmol per liter, as the threshold point. Still another approach is to use D-max which takes the mid-point between the baseline and maximal lactate concentrations. In the end the most important consideration isn’t the way threshold was determined, so much as the concept of Lactate Threshold (and associated terms) as illustrating the non-linear relationship between lactate concentration and exercise intensity.
It is also important to acknowledge that terms like Maximal Lactate Steady State (MLSS), Onset Blood Lactate Accumulation (OBLA), Ventilatory Threshold (VT), Individual Anaerobic Threshold, Critical Power, etc are talking about roughly the same range of intensity. Each of these, MLSS and OBLA in particular, correlate well with the power training concept of Functional Threshold Power (FTP), which is itself defined as your maximal sustained power output for approximately 60 minutes.
Now that we have a clearer idea of what is meant by Lactate Threshold, and we know that Lactic Acid is not the cause of fatigue, let’s look at other factors that might play a role.
Other Causes of Fatigue In 2005 researchers from Edith Cowan University in Western Australia set out to do just that. Models to Explain Fatigue During Prolonged Endurance Cycling, Chris Abbiss and Paul Laursen’s comprehensive review of fatigue literature, looked at no fewer than ten different explanations of fatigue.
Abiss and Laursen point out that fatigue is usually defined by the type of research being done. For example, if one is looking into psychological causes then they will tend to classify fatigue as “a sensation of tiredness,” while a biomechanist might look more at changes in force output to qualify fatigue. Fatigue research is also driven by a reductionist approach; those doing the research tend to look for a single ‘answer’ to the question of fatigue.
Among the different paradigms and models explored were the anaerobic/cardiovascular model, the energy supply/depletion model, neuromuscular fatigue, biomechanical, thermoregulatory, and muscle trauma models. In addition the psychological/motivational model, central governor, and complex systems models were also reviewed. A quick summary of characteristics might demonstrate that:
Neuromuscular fatigue tends to be divided into a question of where along the neuromuscular pathway inhibition occurs, while the muscle trauma model seeks to explain fatigue as coming from damage to the muscle itself, or to alterations in the chemical homeostasis.
The biomechanical paradigm seeks to define fatigue as the result of decreased efficiency of motion, where increasing efficiency lowers the production of metabolites (like lactate) and energy consumption, helping attenuate increases in core temperature. This segues nicely into the thermoregulatory model which looks at the role of core temperature and the increased demands on the physiological systems brought about as a result of increased core temperature towards critical points at which exercise capacity is reduced or terminated.
While psychologically no single variable appears to be responsible for motor output alteration due to afferent (outgoing) signals, it is thought that numerous mechanisms are responsible for the subconscious perception of fatigue and alterations in central activation and perceived exertion.
The central governor and complex systems theories seek to explain fatigue as a function of oversight by an as-yet-undefined central mechanism, or through the complex inter-relationship of multiple feedback loops seeking to maintain homeostasis, respectively.
Their net conclusion is that any number of systems may contribute to fatigue in a specific way for a specific situation, but in general the limitation of the system is derived from oxygen delivery to the muscles, especially at high intensity.
To further clarify in the Abiss and Laursen article fatigue was defined as “tiredness and associated decrements in muscular performance and function.” This is an important point as much research has looked at performance to exhaustion. The relevance comes when we look at how to best apply some of the factors above into the creation of a responsible training program. Many of the changes we seek are built around the optimization of oxygen delivery and increasing metabolic efficiency during the training year, so how does Lactate Threshold help?
Threshold As Proxy An individual’s Lactate Threshold is the single most important physiological determinant of endurance exercise performance. It is trainable, reliable, and a sort of proxy for other important metabolic processes that underlie performance.
For example hormone production, like epinephrine/norepinephrine, shows a similar curvelinear relationship with increasing exercise intensity. Plasma potassium concentration, catecholamine concentration, plasma ammonia concentrations, growth hormone, cortisol and many other elements also demonstrate the same threshold type trends as lactate.
Power at Threshold Now that we’ve established what Lactate Threshold is, how it is determined, and what processes it parallels, let’s spend a little bit of time on what advantages threshold level training can bring to your performance.
For untrained athletes the Lactate Threshold benefits of training can be seen at a wide range of intensities. Simply getting on the bike regularly will bring about many changes including increased mitochondrial density, blood lactate response, and reductions in lactate concentration at a given intensity.
For the trained athlete however, continuous training at intensities around Lactate Threshold has been shown to be beneficial since the time of the fabled East German sports machine in the twentieth century. The East Germans were famous for doing extended hours of training at OBLA!
In a similar vein, Gorostiaga et al in 1991 compared a continuous training group at circa-threshold intensity to one that did only structured high intensity VO2max type intervals (of the type that are all the rage today) and found some compelling differences. While the VO2max group did show a two fold increase in percentage change in VO2max (16% increase v 8% increase), the continuous training group had a ten fold increase in citrate synthase production compared to the VO2max group (25% increase v 2.5% increase). Citrate synthase is one of the main markers for muscle mitochondrial capacity, and is a good reference for total metabolic efficiency.
Both of these examples (the first decidedly anecdotal) serve to illustrate the value of continuous training at an intensity around Lactate Threshold. This has most recently been termed ‘sweet spot’ training, but the idea has been advocated by Lydiard, Coggan, and others in various forms or years. Typically “sweet spot” is defined as approximately 88-93% of your Lactate Threshold power, however the true measure of intensity should be determined by your ability to repeat them over multiple days in a training block.
These circa-threshold efforts should be at least twenty minutes in length, but can last up to two hours or more for advanced athletes. A key determinant of the duration and intensity is your ability to replicate the workout intensity/duration again the next day. A well prepared, motivated athlete doing 60 minutes at 88-93% of threshold power (FTP), should be able to replicate that workload again the second and third days. If you can’t then you probably went too hard, too long, or don’t have a good estimate of your FTP and need to adjust. My suggestion is to start doing some field testing to establish your FTP and then see what you can do. Have fun and let me know how it goes…
References:
1. Abbiss, Chris, Laursen, Paul – Models to Explain Fatigue During Prolonged Endurance Cycling. School of Exercise, Biomedical and Health Sciences, Edith Cowan University, Australia. 2005 2. Coggan, Andy – Explaining Lactate Threshold. Webinar Presentation. 2010 3. Robergs, Robert A., Ghiasvand, Farzenah, Parker, Daryl – Biochemistry of exercise-induced metabolic acidosis. Am J Physiol Regul Integr Comp Physiol 287: R502–R516, 2004
I’m guessing you are kinda like me…a died in the flesh bike folk! I think riding is pretty cool, always have. A few weeks ago I crashed...it sucked (still does if I’m honest) and in the ensuing weeks I’ve watched my previously fit body degrade to a near-heap of flabbiness! Ok, it’s not that bad, but I am down many pounds in weight, and at least some of that is from losing muscle mass.
That’s a somewhat hard pill to swallow at 50 because muscle mass doesn’t come back quite as readily as it did when I was younger. While I wasn’t riding I also wasn’t shaving my legs – honestly, it looks way worse than a little less beefcake on my glutes and is far more visible. Indeed hairy legs are pretty gross, especially cyclist hairy legs because it doesn’t grow back in anything resembling sexy…at least mine don’t. Instead it grows back kinda mealy and hopeless…
Eww….that’s just wrong!
So after gathering a quasi-covering for a few weeks, feeling apathetic about the prospect of riding much at all, and determined to turn the corner on my apathy I shaved my legs yesterday! Ok, I shaved 1/2 my legs yesterday…it takes awhile! I made it all the way to the knee on both legs and instantly felt like a cyclist, at least a little bit!
This blog is about coaching, so let’s talk coaching.
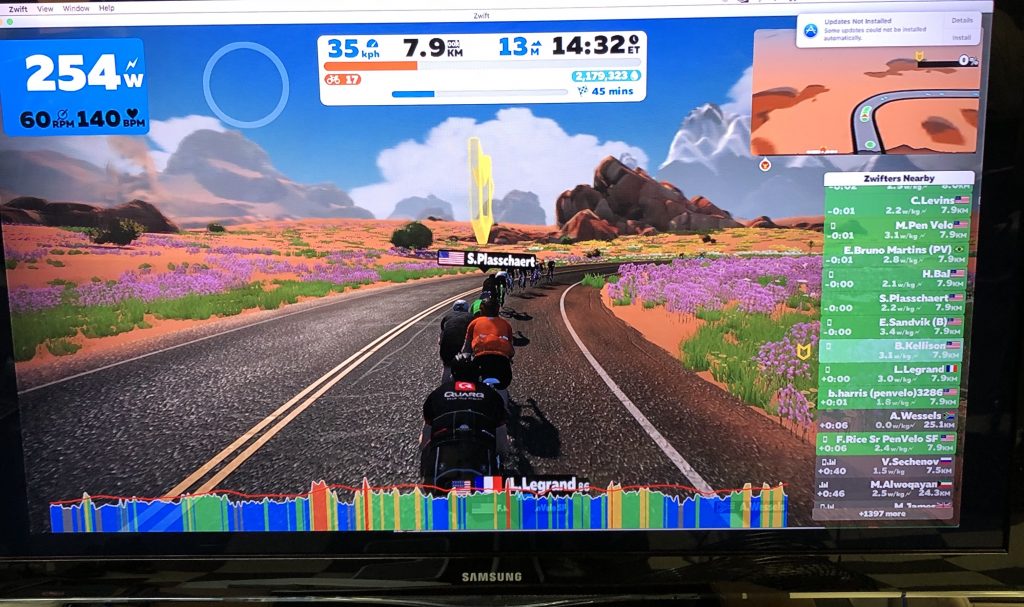
It’s December and riders around the World are getting antsy to get after their 2020 preparations. Zwift is on the rise thanks to a revolution in indoor enjoyment, improved accuracy of the metrics, and most importantly the social element!
I coach a team and despite living in largely fair weather Northern California (#NorCal) we DO get our share of foul weather from time to time and lots of my riders have serious and demanding jobs, so more and more they look to maximize their bike time and thus, we’ve been playing with Zwift and their group ride option. It’s actually proven to be very cool in a couple of important ways
It’s A Group Ride! How many times have you been on a group or endurance ride that degrades in the first 20 minutes into a battle of watts per kilogram and drafting acumen becoming the inevitable hammerfest? Yea, me too. Zwift managed to alleviate at least a couple of these elements with their online rides. Simply join the ride a couple of minutes before the start, keep pedaling all the time (yep, even softly) and you stay in the group. Maybe you feel like “getting a workout” and want to put the hammer down? Easy, go hard, as hard as you want…you won’t drop your frenemies, you’ll just get that workout you wanted.
Talk, talk, talk! Ok, while hammering along in an un-droppable peloton is fun, wouldn’t it be more fun to punch out some lively banter with your ride-mates along the way? Well, thankfully Discord gives that option. Just create a group chat and light it up! My riders have found that when connected properly the group chat really does add that community element (just remember to get that whisper quiet fan!). We’ll be playing with music in the next few weeks and hope that adds yet another element of awesome to the mix 🙂
Intensity? We got your intensity! As a coach I care about the workloads my riders engage in. I don’t need to control every ride all the time, but I also don’t want them running roughshod over each other three days a week in the off season. To help with that we’ve been playing with adding structured workouts to the group ride. So, if I want my riders to do 4 x 15min “sweet spot” efforts, no problem. Indeed, if I want half of my riders to do that and the other half to hit up some neuromuscular intervals, we just run two different programs! This is easy via using my #sterlingwins hastag to find workouts, but even easier for my athlete because they all have Training Peaks accounts – i just load the workout for the day in question, they already have their accounts linked between Zwift and Training Peaks, so they can sync automatically and OFF THEY GO!
Check back as I’ll be updating this post with new information as we get up to speed over the next couple of weeks!
I recollect my weight pitching forward, my arms desperately seeking a perch to stave off the coming catastrophe. Peripherally green foliage on the side of the road beckons – I have a particular dislike of road rash and thought I could soften the landing a bit. It’s the second time that preservation instinct has come back to bite me. The next recollection was being pushed into a CAT scan machine. My arms were on my chest and thus too big to fit in the small space. Everything else is a blank…
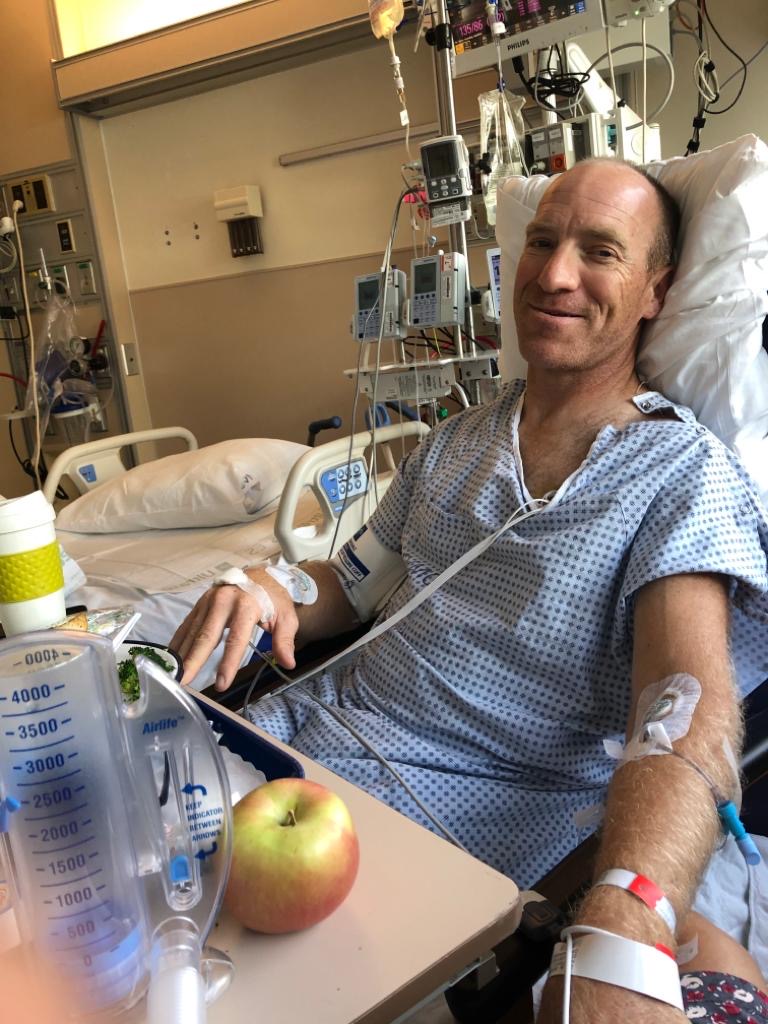
Seems there was an ambulance ride, and thirty seconds of unconsciousness preceding that. The park rangers came as well. I don’t recall them either. An oxygen mask on my face and the dull sensation of pain, lots of pain. No idea how long I was in the ER before being transferred to the ICU where I would remain for the next two and a half days. Intensive care was certainly intense, they had me exercising my lungs within a few hours of arriving via a breathing apparatus that measure inhalation – I was pleased to pull 1500mL. My cadre of nurses took good care, great care of me and I am thankful . Finally deemed stable enough for the trauma recovery ward, I earned another three and a half days of breathing exercises, not much appetite and a “once-every-fifteen-minutes” pain button that, I guess, dumped a bunch of opioids into my bloodstream.
I dropped almost 10lbs…
A few weeks shy of my 50th birthday, yet a few more weeks before my season target of Cyclocross Nationals it all came apart. Any thoughts of a “quick” return were immediately dispensed thanks to the lung exercising machine. I’d made 2000mL a few times, but it hurt in that deep way of serious injury to do so.
Yet, even in the midst of the pain and fogginess there was a modicum of enthusiasm for the opportunity presented. I wasn’t dead – yea, sounds cliche to me too, but honestly a few inches to the right and perhaps my spine is broken more than the 12 cracked transverse processes. A harder hit and maybe my brain is more deeply traumatized or maybe the rib that punctured my lung goes deeper and causes some heavy damage. I don’t dwell on these what if scenarios, but i am aware of them and with it comes some emotional rawness…
A few days after leaving the hospital it all becomes too much. I hurt all the time, my body is broken, I am alone in my house with no one watching over me and I cry. I sob quietly, for to sob unreservedly is beyond the tolerance threshold, so I sit shaking as tears fall. They fall from sadness at what I’ve done to myself, they fall in longing for the sweet voice of my lovely daughter, the fall from hopelessness. I won’t not hurt for a very long time. I won’t walk, run, ride or laugh as I usually do. I have to go back downstairs and it is daunting. I cry for the first time since putting my cat down 18 months past, but this time I cry from the anguish of what’s happened and what’s to come, not from the heartache of loss.
The next morning it is better. I feel energized and alive again, I talk to my family – my dad calls me everyday in the hospital just to see how I’m doing, and keeps doing it when I’m home. I am thankful for my friends and family and for the respite from the black clouds that hung over me. I will cry again in much the same way a week or so later while visiting my family in Colorado, and again will feel restored the next day. I will spend everyday with my kid, with my family. Doing simple things or nothing. In these moments I find a certain calm, a deeper patience with myself and others.
Now five weeks out I see improvement each week. I slept on my back for awhile last night instead of sleeping upright as the past four weeks had dictated. I can put a shirt on without pain, my back is not stiff all the time, the bruising is gone. I am on the “path back”…but I will be different from the experience.