Racing season is taxing! Focused rides chasing ultra specific watts and heart rate values and races where you are taxing yourself time and again in pursuit of results. Frankly, the pursuit of excellence can become monotonous. Thankfully, nature gave us the fall! So what is one to do if the idea of one more watts based workout may push you over the edge into madness?
if you are lucky enough to live where fall is a time of brisk mornings and warm, though shorter, days – versus those just entering summer (lucky ducks!!) or worse, those already feeling winters grasp (d’oh!), then you may find yourself aimlessly wandering through your “offseason” rides as the very idea of another watts based interval session sounds about as fun as repeatedly kicking a wall barefoot. Take heart, you have at your disposal the opportunity to reinvent your riding AND save your brain in the process!
Instead of simply following your old habits out of habit, why not try something completely novel this off-season? Indeed, it may well be a necessity to use your technology, but it is possible – and advisable – to use it differently. Here are three ways to freshen up your training by tracking different metrics.
Intensity Factor
I’ve recently challenged myself and my athletes to look at their workouts from different perspectives. For example, I’ve started using Intensity Factor (IF), Kilojoules, and RPE as the metric of choice for a given ride or block of training.
Intensity Factor is a great way to add some diversity to your rides. IF, in cool coach speak, is simply a measure of the difficulty of a particular ride or interval relative to your Functional Threshold Power (FTP). Most of us, riders and power-based coaches, use FTP as the common metric of measure for workouts and intervals. We look at average or normalized power for an interval and give you a thumbs up or a thumbs down. IF, on the other hand, offers a different approach to quantifying your ride. According to the Coggan/Allen power terminology that has become defacto, Intensity Factor is of stated as “simply the ratio of normalized power to your threshold power” where, for example, a long effort at your FTP (for example 60 minutes) elicits an IF of 1.0. While this simple explanation covers the basics of what IF is, there is also a range IF efforts that are quantified by the Coggan/Allen system as follows:
IF < 0.75 equals a recovery ride
IF 0.75 - 0.85 equals an endurance paced training ride
IF 0.85 - 0.95 equals a tempo ride, aerobic/anaerobic interval workouts (where work and rest periods are combined), and longer road races (over 2.5 hours)
IF 0.95 - 1.05 equals lactate threshold intervals (work period only), criteriums, circuit races, longer TT’s (eg 40Km) and shorter road races (under 2.5 hours)
IF 1.05 - 1.15 equals a shorter TT or a track points race
IF >1.15 equals a prologue TT or any of the shorter track events
Great, so how does this alter your training? Well, in substance it doesn’t really change your training. Work is still work, and the process requires work, however, if you find chasing watts mundane, substituting IF for a series of intervals may just fit the bill. Here is a recent workout where I used IF as my overarching reference while using watts for individual intervals.
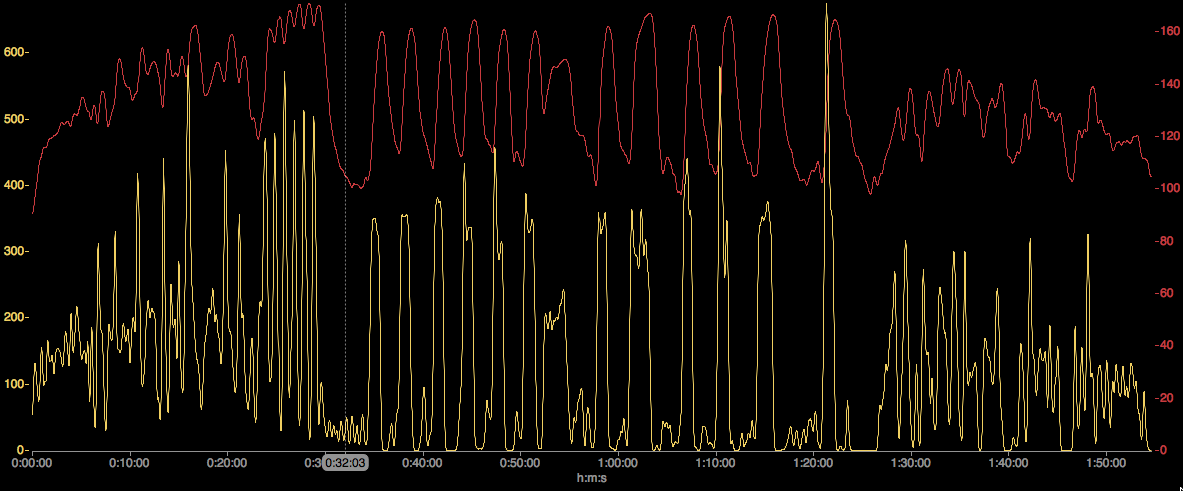
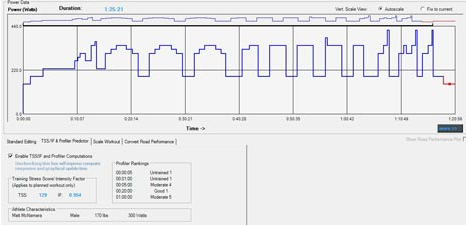
you see below that there are multiple hard efforts, this workout was targeted MAP (maximal aerobic power) via a series of 1 – 2 minute efforts at my current MAP of about 350W. First off I did a 6 minute block of 30 seconds “ON” and 30 seconds “OFF” where on was above 350 Watts, and off was easy pedaling. Over the course of this initial interval my average power was 257W (roughly 91% of my 280W FTP), but my normalized power was 313W (112% of FTP) which, given the definition above, means my IF was 1.12 as well. You can also see that heart rate gradually sloped up and to the left during the entirety of the effort, as one would expect for an effort 12% over FTP. Average HR was 162 ( about 93% of my Threshold HR of 174bpm) but max HR was only 172bpm thanks to the short duration of the “ON” period.
Recall that my big picture metric was IF on this ride. If we go back and look at the 21:00 minutes up to the start of these on/off efforts my IF was only 0.79 (222Wnorm, 138HRavg), but by the end of the 6 minutes of on/off it had jumped to 0.88 (247Wnorm) but HR had only risen to 142bpm so far. Pretty good IF return for 6 minutes of work!
After that I rested for 4:45 minutes before starting the MAP work. During the rest period my IF was 0.16 (45Wnorm) and average HR was only 114bpm, however even with the downtime my rolling IF for the full ride was still 0.85 (239Wnorm, 139HRavg), cool!
Looking at the rest MAP work we can see that the intervals themselves netted me 45 minutes at an IF of 0.93 (260Wnorm) at an average HR of only 133bpm. While it may not sound that taxing, trust me, I was happy to be done with them! Here’s the fun part, and why using IF for this workout proved particularly useful to me…rolling IF at the end of the MAP intervals was 0.90 (252Wnorm) at an average HR of 135bpm, but my motivation to keep my IF high helped me stay focused on the work at hand even when I was tired, I wanted that high IF score more than I wanted the individual power on an interval late in the workout. Overall, including the casual ride home, I netted an IF of 0.83 in a 2 hour workout with 133TSS – right in line with the chart above for an aerobic/anaerobic workout. Certainly I would have gotten largely the same metrics using just interval power as a reference, but it was refreshing to “chase” something else for awhile!
Kilojoules
Another novel metric may be tracking Kilojoules during a workout. Kilojoules (KJ) represent the actual work done. A kilojoule is defined as 1000 joules or 0.239 calories. A Joule is a “derived unit of energy in the International System of Units” according to Merriam Webster’s online dictionary. A joule is equal to the amount of work done on an object when a force of 1 Newton acts to move it one meter (ergo a joule is a Nm), or more specifically for our purposes a joule is the amount of force necessary to produce 1 Watt for 1 second. Scientists and others often use kilojoules as a defect representation of Caloric work done on the presumption that the human body is about 25% efficient (75% is lost as heat), so 1000Kj is roughly 1000kcal or 1000 Calories of energy expenditure. So, long story short, it’s a great way to quantify, roughly, the energy you’ve used.
So why would you use KJ’s as a training metric? It is a great way to quantify your work in another way! Go back and look at your hardest ride or race of the year. How many KJ”s did you burn? When did you use the most KJ’s in a given amount of time, say 5 minutes? One of the key references in performance improvement is the ability to produce really good power numbers after doing a lot of work. A simple comparison might be to look at your mean maximal five minute power after 500KJ, 1000KJ, and 2000KJ, or whatever number you find best represents the demands of a particular event. Were you able to produce 90% of your maximal five minute power after 2000KJ’s? If not, working to improve that may be a great way to improve your race performance! Similarly, what is your maximal KJ’s produced over a given time? Sure, this is largely akin to your max power over that time (more max power = more KJ’s), but recall that we are looking at novel ways to quantify your training. I will often have my riders do 1,500KJ rides with no other prescription. If they choose to try and complete the work in 2 hours, they’re gonna have to ride pretty hard to get 750KJ’s an hour. Then again, maybe they have the time to do it over 3 hours, or 500KJ/hour, which is considerably less difficult. Of course body weight matters so you’ll want to baseline some values before you try and slay yourself to the god of Newton meters!
Perceived Exertion
Finally there is the oft overlooked metric of RPE, or Rating of Perceived Exertion. Typically RPE is based on either the Borg scale or a modified version of the Borg scale. The classic Borg scale lets you self-rate an effort from 4 – 22, while the modified Borg scale is usually from 1-10. Here are a couple of graphical representations and their anticipated intensity:
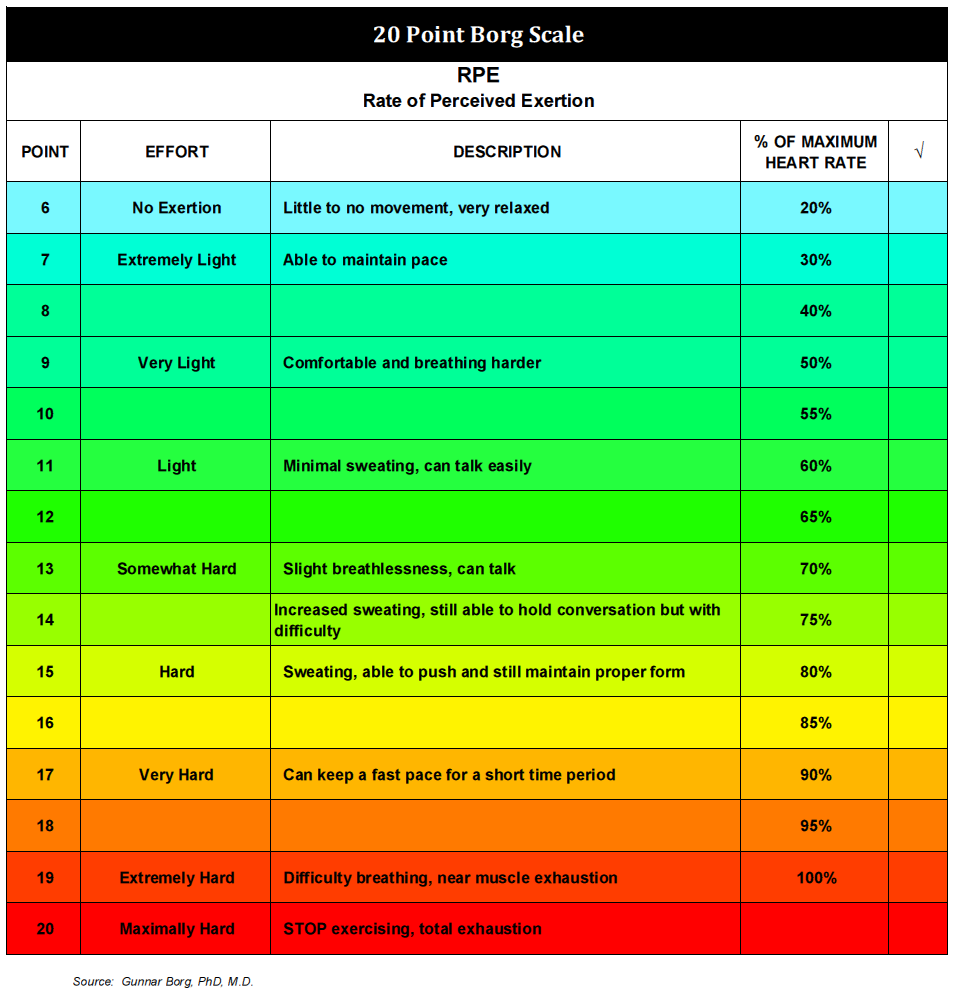
The Original 20 Point Borg Scale
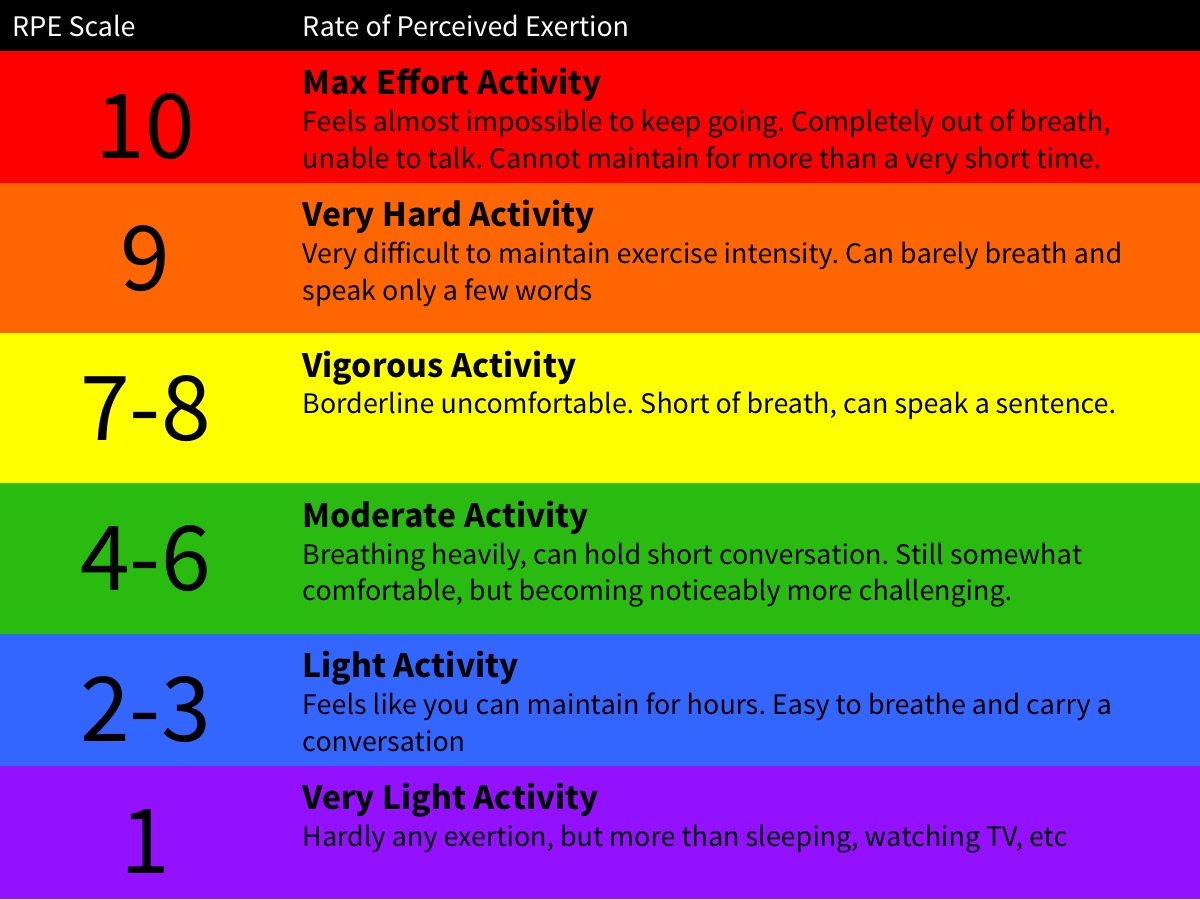
The Modified 10 Point RPE Scale
To further complicate things, Andy Coggan came up with a different RPE scale that he tied to power and heart rate values. This is his scale:
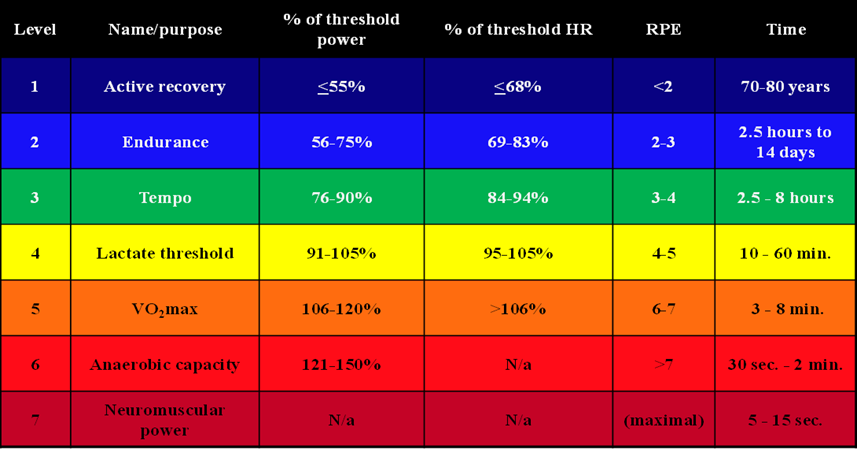
RPE is a great metric for a whole host of reasons. First, it requires no computer…it is just your assessment of how hard you are going! This is especially valid in the dial down from a long racing season when motivation may ebb and the desire to have a bit of fun often rules the day. Using RPE, one can meet training expectations without having their nose stuck in their GPS device! Then again, given the preponderance powermeters, and the luxury of having access to lots of data, backstopping your RPE against power data can be very useful. For example, I might have a rider go out and do a 20minute test asking them to maintain an RPE of 7 or 8 on a 10 scale. They still have a training “goal” but it is independent of a fixed reference. RPE is also a handy way for an athlete to find new levels and comfort with the inevitable, those hard efforts that require diligence and attention. “Comfort” may not be the right word, perhaps tolerance is a better word. Tolerance of personal discomfort is a mandatory part of improving as a cyclist, taking a somewhat psychological approach, in the end the mind often rules the day, is a great way for a coach or individual to begin resetting their comfort levels and ability to survive those efforts that often make or break performance.
Summary
The end of a racing season is not the end of training. Indeed, the fall is often the time riders can make substantial gains in their overall capacity and fitness. Unfortunately, the task of adhering to the same training metrics throughout a training year can prove unwise in the realm of exercise tolerance, freshness, and avoiding burnout. On offer here are three different metrics that might be of interest to riders seeking a novel approach to their training. Intensity Factor (IF), Perceived Exertion (RPE) and tracking Kilojoules (KJ’s) can be viable alternatives for those looking for something new. IF and KJ’s are both co-measures of power based training, simply looking at it from a slightly different perspective to the traditional watts for time approach. RPE, on the other hand, is a largely self derived measure that can help an athlete to find new thresholds of tolerance, and can be backstopped with power data to further refine training. Wether you choose from these three, or come up with new measures of your own, shaking up your training throughout the training can be an effective way to maintain and improve your performance in the long run.